library(readxl)
library(dplyr)
library(lubridate)
library(ggplot2)
# Read data and correctly parse the date
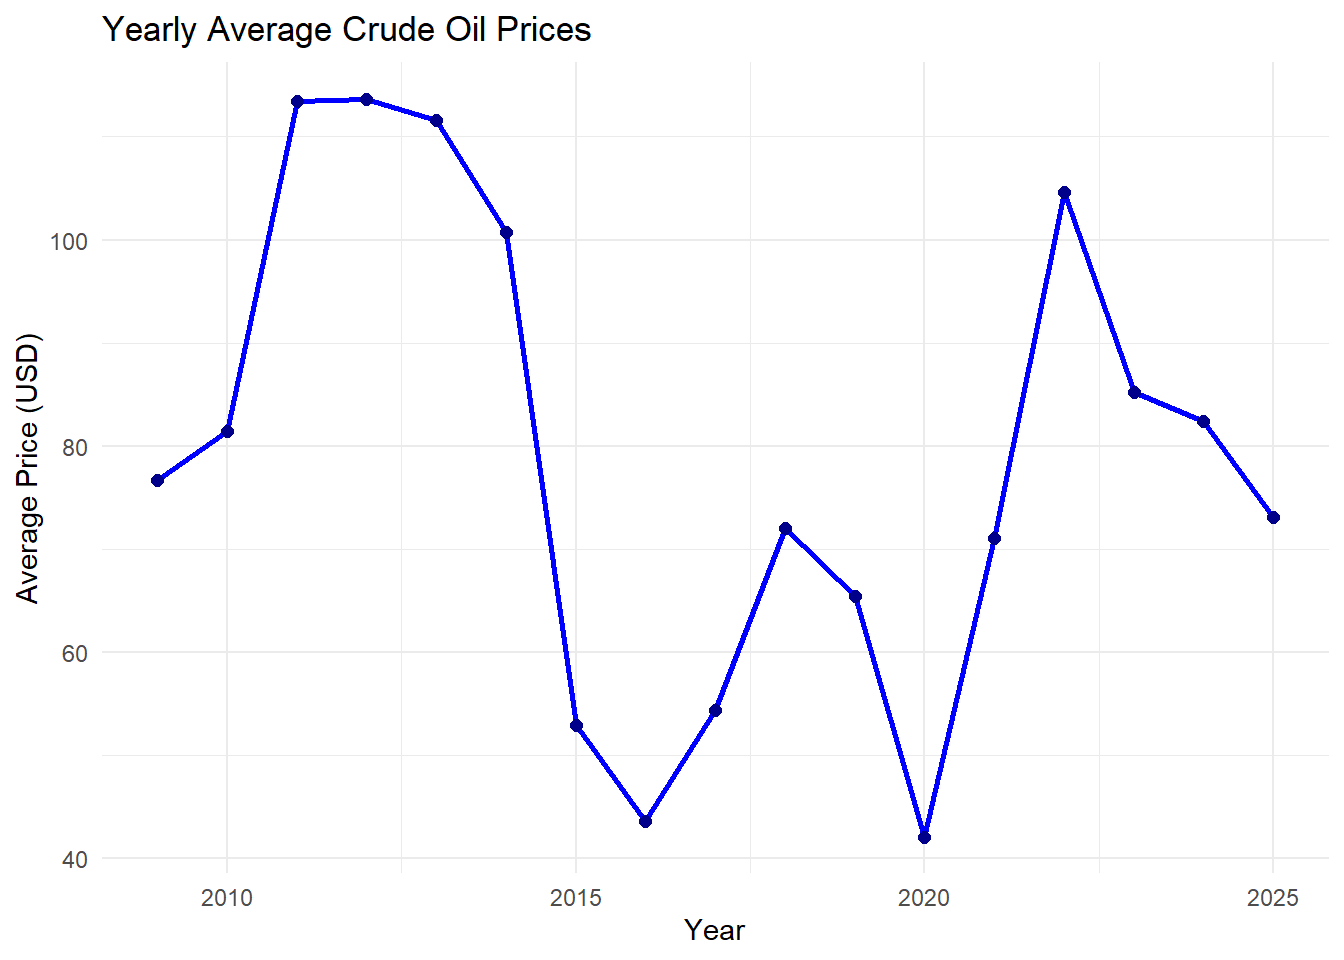
yearly_oil_prices <- daily_oil_prices |>
mutate(Year = floor_date(Date, "year")) |>
group_by(Year) |>
summarise(Avg_Price = mean(Price, na.rm = TRUE))
# Plot monthly average prices
yearly_oil_prices |>
ggplot(aes(x = Year, y = Avg_Price)) +
geom_line(color = "blue", size = 1) +
geom_point(color = "darkblue", size = 2) +
labs(title = "Yearly Average Crude Oil Prices",
x = "Year",
y = "Average Price (USD)") +
theme_minimal()